|
Interval Charts (Fractal Edition) Another helpful feature of Cenon Astro are the Interval Charts, showing several times at once, and thus giving an overview over the time flow of the resonant aspects and peaks. With activated Astro-Clock, it is fun to watch the changing strengths on the screen. |
||
|
Interval Charts
|
||
|
A click on the image displays the full size image. |
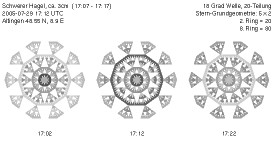
Intervall Charts The image once again shows the hail in Ammerbuch, now as Interval Chart with three points in time and a time interval of 10 minutes. The center star shows the maximum resonance exactly in the middle of the hail, which went from 17:07 to 17:17 UTC. The display of Interval Charts can be switched to color, of course. |
|
|
A click on the image displays the full size image. |
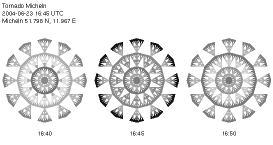
The image shows one of the rare Tornados in Germany. The time interval is 5 minutes. Cenon offers almost unlimited possible variations of the Interval Display via the editable Chart Masks used by Cenon. You can display a whole Astro Chart for each interval or just some parts. Each chart feature can be activated separately in the chart masks, allowing you to create your special chart. Of course you are not limited to the investigation of weather events with this beautiful tool, but weather - without any doubt - is one of the best opportunities, allowing the adjustment with exact data. Here we have a Collection of some every day events displayed in Interval Charts using the hierarchic stars. |
|

